
Chapter 5 · 5 of 6
Under the hood — for builders
Optional reading for implementers and contributors. How a legacy runtime is captured as data rather than code, how the analysis stays organised internally, and the engineering rules that keep the whole thing honest.
This chapter is for people who want to build on the tool or contribute to it — if you just want to use it, you can skip it. It opens the hood on three things: how new runtime knowledge gets added as data, how the analysis keeps itself organised as it works, and the discipline that holds it all together.
Runtimes are data, not code
A born-digital work might depend on Director, Java, Flash, QuickTime, VRML — or, more often, several at once: a web page that embeds a 3D plugin that calls a backend that is long gone. So each runtime is captured as an expert module, and a module is a row of data — not a branch of code. Growing the tool’s coverage means adding catalogue entries, not rewriting the engine.
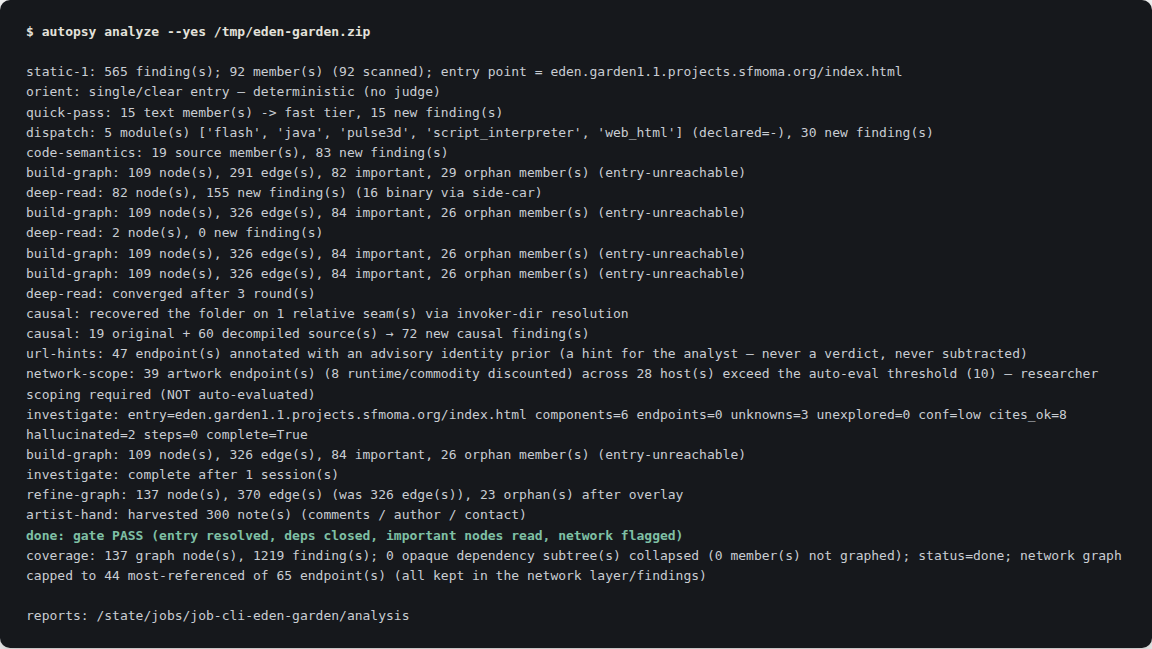
The catalogue today covers twenty-one runtimes — Director, Flash, Authorware, Java, QuickTime, VRML / X3D, native Windows (PE), .NET, classic Mac, HyperCard, web / HTML, DOS, console / handheld ROMs, interpreted scripts (Perl / Python / Ruby / shell), Max/MSP, ScummVM-engine multimedia, modern web, Firefox extensions, Safari extensions, Pulse3D and Unity. Two of those, Pulse3D and VRML, are exactly the ecosystems behind the Eden.Garden case on the research site — the kind of dead plugin these modules exist to recognise.
Not only legacy. Modern web art has the same shape — a runtime frozen at one moment, servers that may already be gone — so the same machinery reaches it too. An Electron application is unpacked to its Chromium + Node runtime and pinned to the version it bundles; a browser extension is read across its format eras. The preservation problem is identical; only the decade differs.
Those runtimes that must be decompiled to be legible pair their catalogue entry with a deep-reader — the decompiler or disassembler that turns the runtime back into something readable for the analyst; the rest ride the generic readers. What the deep-readers cover today:
.exe.navigateToURL/getURL call site.The detection ladder
When a work does not declare what it needs, identification climbs a ladder from weakest signal to strongest:
CAFEBABE).A curator’s declared runtime, or a known one from a knowledge base, is treated as a human-authority prior — it outranks the model, though the bytes can still raise a conflict for a person to resolve.
Modules compose; the open world stays open
When several modules match, their analysis plans union, their environment recipes merge in
host→guest→network order, and their fidelity notes concatenate. When nothing
matches, an open-world _fallback degrades to a flagged needs-human
guess at the lowest authority — never a confident wrong answer. As a collection’s
“zoo” of works grows, the catalogue grows (data), so the approach compounds instead of
resetting per artwork.
The shape of a module
Adding or sharpening support for a runtime is one catalogue entry that co-locates everything needed to identify, analyse, re-run, and conserve it:
- name: <human label>
  id: <stable dispatch key>          # also the declared-runtime alias target
  aliases: [...]                     # strings a curator/KB may use
  magic_bytes: [{offset, hex, ascii, note}]   # byte signatures (high confidence)
  container: {...}                   # RIFF / ZIP / PE-dir / atom 4cc
  era_os_hint: {eras, base_vm}       # era → base-OS class (feeds suggestions)
  analysis_plan: [{tool, action, extract}]    # runtime-specific deep read
  env_recipe: [{layer, step}]        # ORDERED: base-OS → player → deps → config
  re_runner: {modern: [...], original: [...]} # engines (Ruffle / X_ITE / …)
  fidelity_notes: [{layer, risk}]    # identity-defining experiential risks
known_endpoints: [{host, use, status}] # the runtime's dead servers → proxyHow the analysis stays organised — the RunGraph
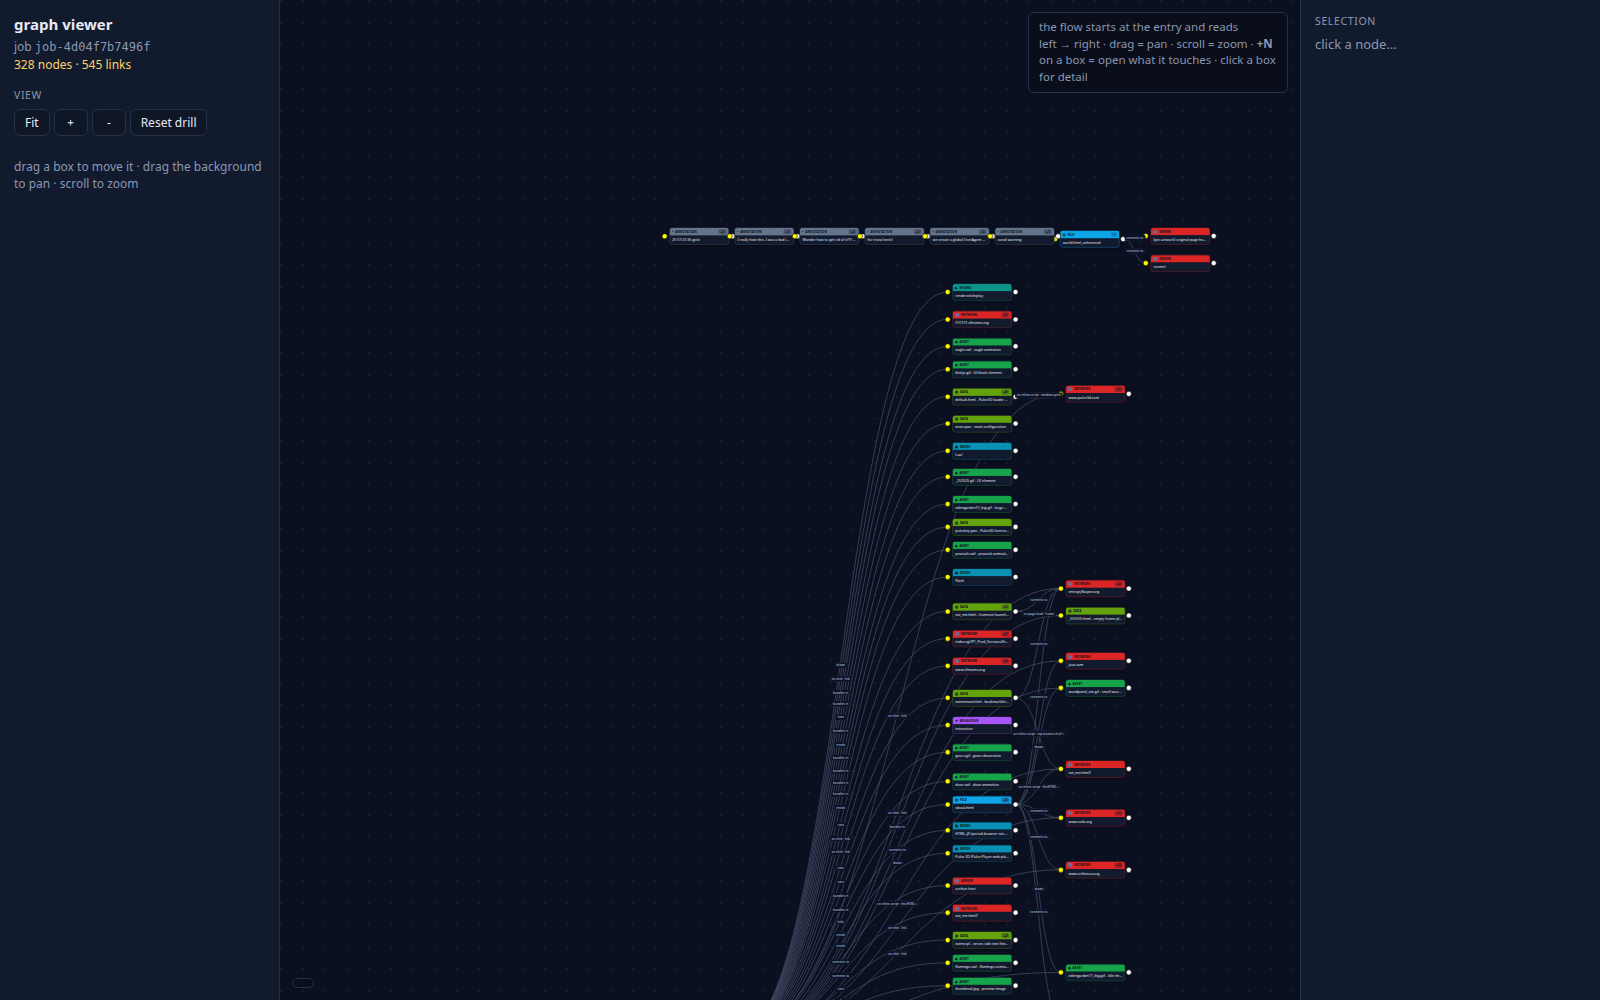
Before any model runs, the static core builds a RunGraph — typed nodes (entry, binary, runtime, data, config, network) joined by typed edges (imports, reads, contains, connects). Findings attach to nodes rather than piling up loose, so a fact is discovered once, not re-derived. The graph is the analyst’s map: it navigates those nodes to decide what deserves a close read, its completeness gives the “done” check something concrete to measure, and it is exported as JSON, a diagram in the report, and an interactive flow viewer in the web UI — node boxes and wires, laid out left to right, so a person can follow the same map the analyst walked.
The engineering discipline
Ports-and-adapters, with a framework-free domain core and a continuous-integration import-ban
guarding the boundary so the core never grows a dependency on the plumbing. A simple HTMX web UI
(switchable off in fleet mode) and a REST API over one core. Work is scheduled through a
Postgres job store — one row per job, claimed with
FOR UPDATE SKIP LOCKED and kept alive by a heartbeat, so two runners can never take
the same job and a healthy multi-hour analysis is never stolen for going quiet. Each claimed job
runs as its own subprocess: all the analysis happens in the child, so a crash,
hang, or out-of-memory kills that one job, never the loop — and scaling is just more
runners. A LiteLLM seam (standalone or a fleet gateway) reaches fast and deep model tiers
by a swappable alias. MIT-licensed, intended for open release so others can build on it.
One engine, two jobs
The same loop also runs in reverse. Pointed at a catalogue of known legacy-runtime tools rather than an unknown artwork, it fills in their metadata automatically — the model proposes, a human reviews (stub → draft → reviewed → published). Same engine, lower risk, immediate payoff.